Incident Management Software (IRIS)
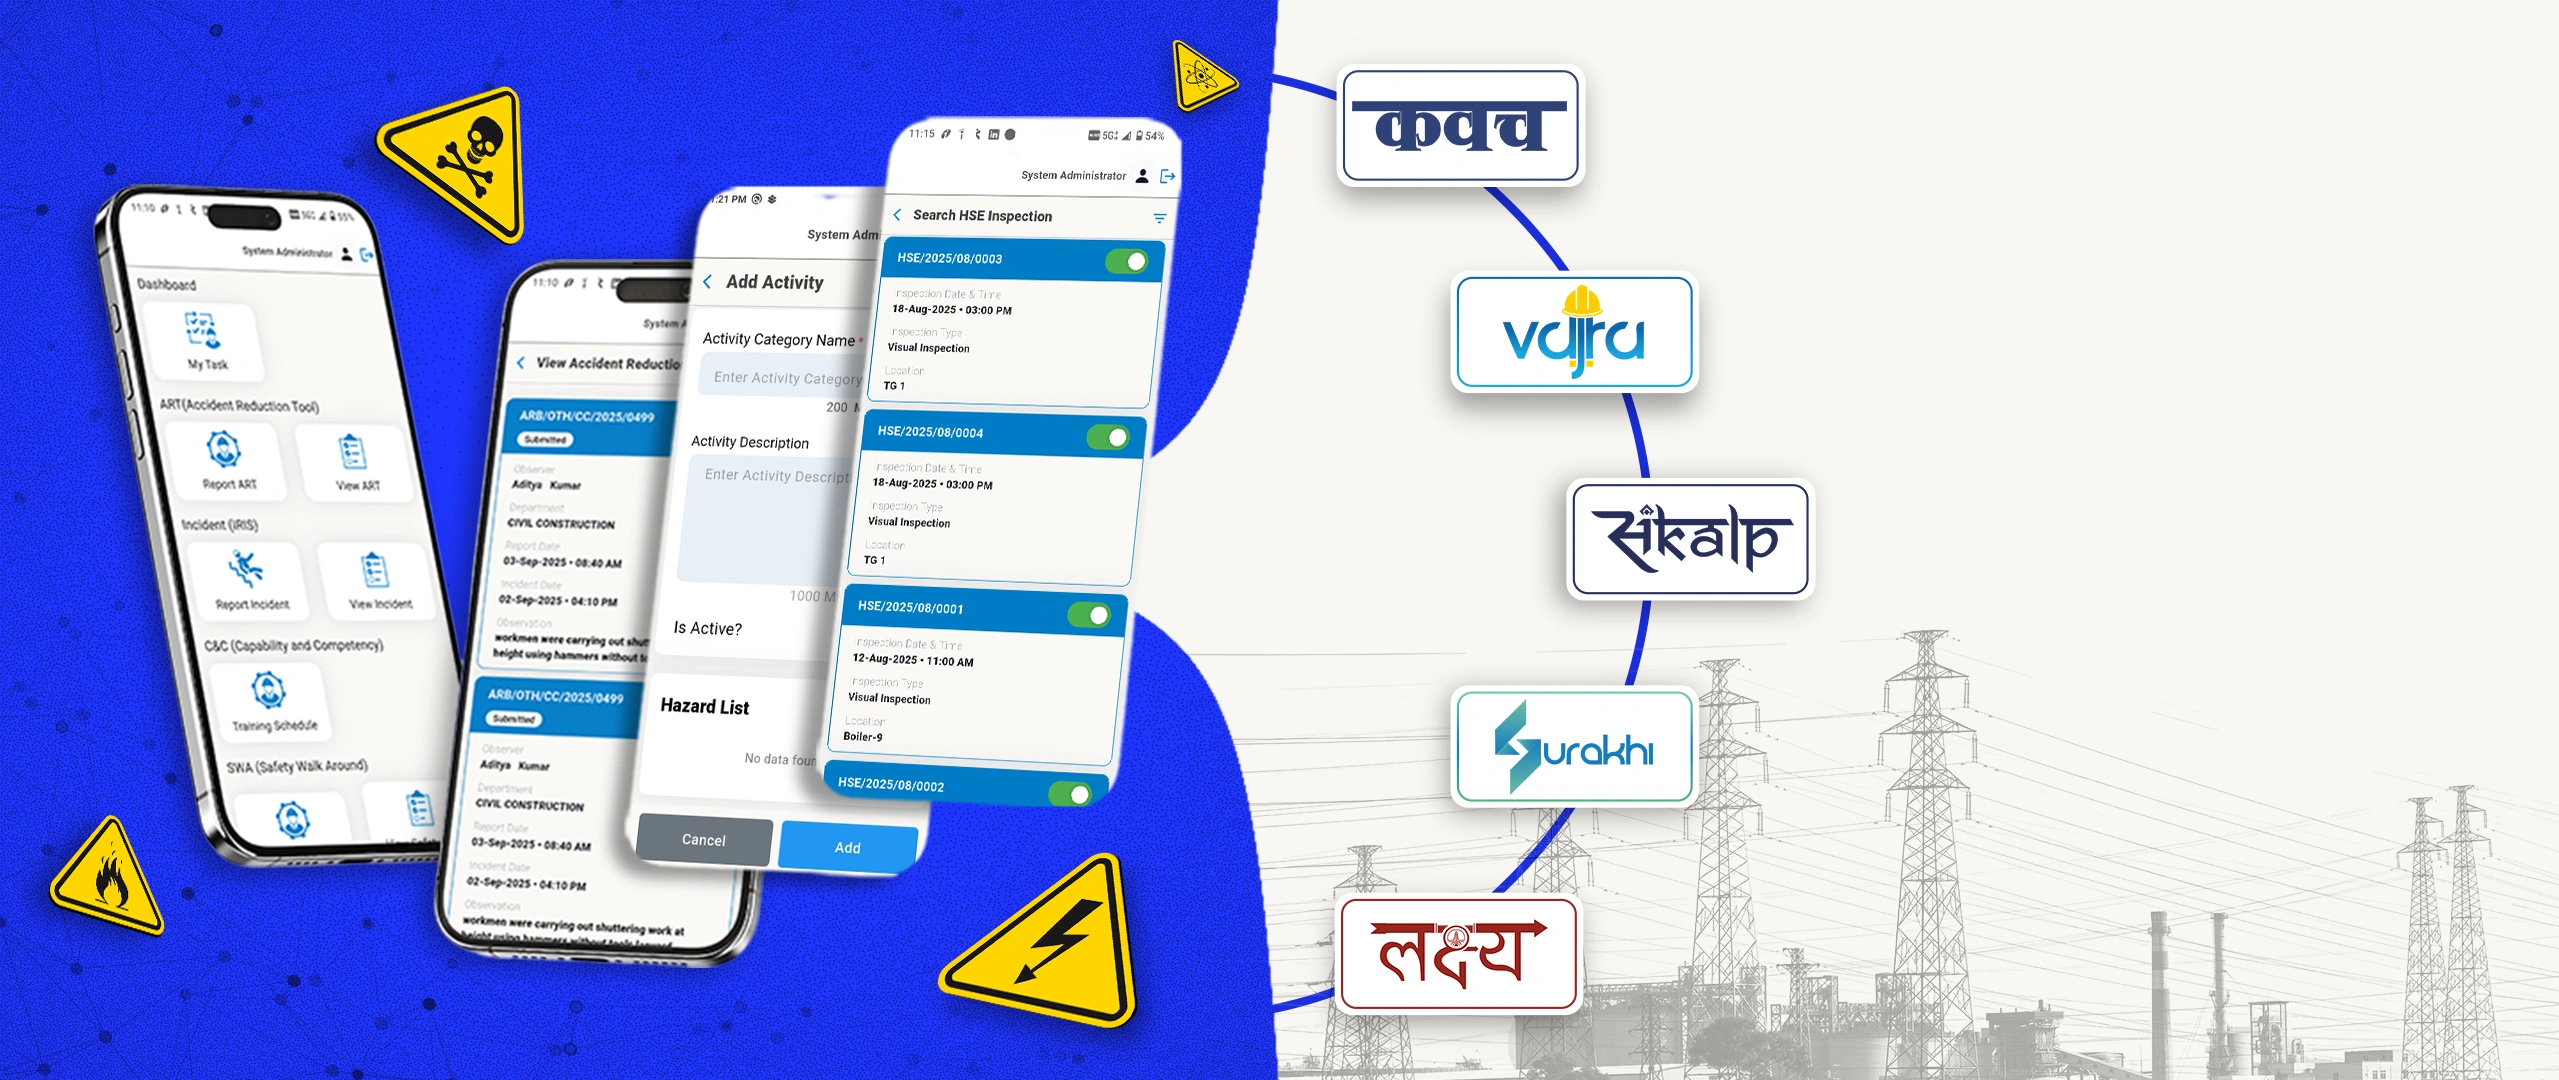
Workplace safety starts with how incidents are reported, investigated, and resolved. Traditional paper-based systems often lead to delays, missed learnings, and repeated risks.
Visualize Safety. Drive Performance.
CORE-EHS Safety Dashboard – A smart analytics platform that transforms safety data into actionable insights, empowering proactive decisions and a stronger safety culture.
EHS Safety Dashboard Software is a real-time analytics and visualization platform that consolidates your safety data, incidents, inspections, training compliance, and leading and lagging safety indicators, into a single interactive view, so EHS teams and executives can spot trends and act before risks turn into incidents.
CORE-EHS safety kpi dashboard goes further by turning that visibility into engagement: employees can share ideas, report concerns, and suggest improvements directly through the platform, fostering a proactive, transparent, and continuously improving safety culture.
Safety Dashboard – Trusted Safety Software for Modern Industries
CORE-EHS Safety Dashboard gives every role, from frontline teams to executives, real-time visibility into safety performance, so issues get flagged and acted on before they escalate.

Contact Us
Supports safety teams in managing safety activities, organizing reports, and improving overall safety performance across the organization.
Gives leaders better visibility into safety performance and trends, helping them make informed decisions and support risk reduction efforts.
Enables employees to follow safety processes easily, report issues when needed, and stay actively involved in improving workplace safety.
Even data-rich organizations struggle to turn EHS information into meaningful action due to:
Safety data scattered across spreadsheets, systems, and departments.
Time-consuming manual analysis limits timely response to emerging risks.
Leadership often lacks a unified view of organization-wide safety performance.
Workers rarely contribute feedback or ideas for safety improvement.
Traditional reports fail to highlight predictive trends or future risks.
No clear visibility into how corrective actions impact long-term performance.
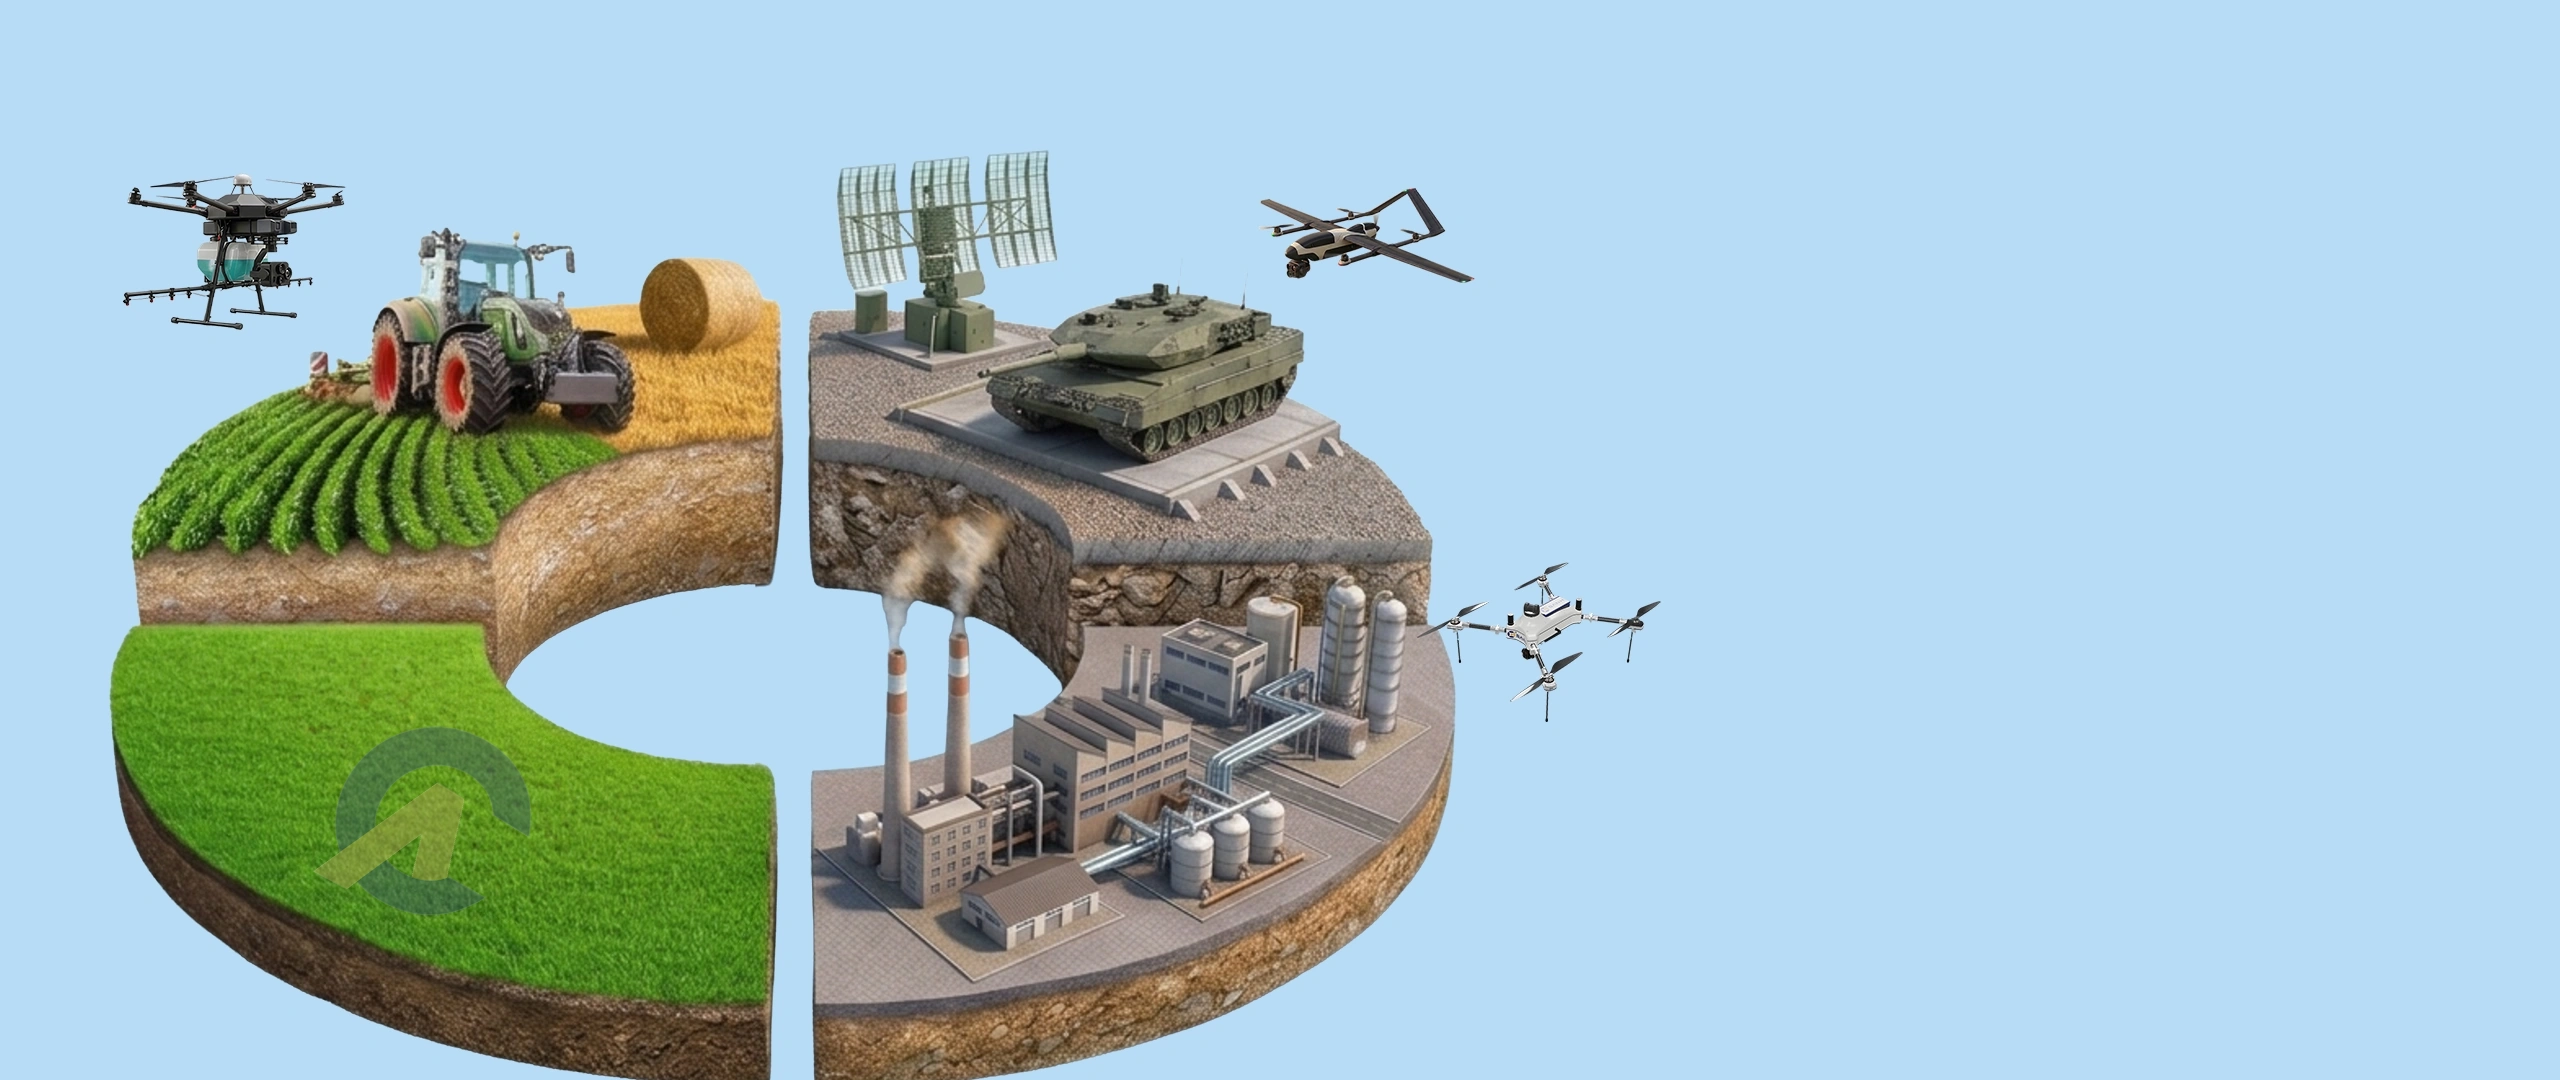
Supporting safer operations across high-risk and safety-critical industries.
Engineering
Automobiles
Automotive & Mobility
Power
Iron & Steel
Cement Industry
Metal & Mining
Shipping & Marine
Construction & Infrastructure
Chemicals & Fertilizer
Pharmaceutical& Life Science
Food FMCG & Agriculture
Electrical & Electronics
Retails & Consumer Durable
Petrochemical, Oil, Gas & Refinery
With CORE-EHS, organizations gain access to a range of powerful capabilities, such as
Explore integrated EHS software modules for incident reporting, hazard management, audits, compliance, and real-time safety performance tracking.
To know more about us
A safety dashboard is a real-time visualization tool that consolidates EHS data, incidents, inspections, training, and KPIs, into one interactive view, helping teams and leadership track safety performance at a glance instead of digging through spreadsheets and reports.
A safety KPI dashboard tracks the leading and lagging indicators that matter most to your organization, such as inspection completion, training compliance, and incident trends, so teams can spot risks early and measure progress over time.
An Excel template can work for a small, single-site team, but it needs manual updates and can’t show live trends. A connected safety dashboard automatically pulls data from incidents, inspections, and training records, updating in real time across every site.
The terms are largely interchangeable. Both refer to a visual platform for tracking safety performance, a health and safety dashboard sometimes places extra emphasis on occupational health metrics alongside incident and compliance data.
A process safety dashboard focuses on hazard and risk indicators specific to industrial processes, like equipment integrity, hazard identification, and management-of-change status, giving process-heavy industries such as chemicals, oil & gas, and manufacturing a dedicated view of process-related risk.
Yes. CORE-EHS offers a live demo so you can see real dashboard views, incident tracking, KPI widgets, and trend charts, configured for your industry before you decide.
A configurable safety dashboard template can track metrics like incident and near-miss trends, training compliance rates, audit and inspection completion, and corrective action closure, giving both frontline teams and executives the visibility they need.
Yes. A cloud-based safety dashboard can consolidate data from multiple sites, departments, or business units into a single view, letting leadership compare performance and spot trends across the whole organization instead of site by site.
Stay updated with insights on safety software, risk management, process safety, and regulatory compliance.